Deployment status information (lists of deployments, computers, and other details) is displayed in the following places in PDQ Deploy:
•All Deployments page (shows all deployments in the system)
•Deployment Status Page Details
•Package page - Deployments tab (deployments for the selected package)
•Deployment Status window (status for one deployment).
•Schedule window - Target History tab (deployment for the selected schedule)
The various panels display information during and after deployments.
Deployment information is kept in the database until it is manually deleted or automatically cleaned up. The cleanup process ensures that old deployment history is cleared out. The default cleanup interval is set to 30 days. For more information, see Cleanup settings in Deployments Preferences.
All Deployments PAGE
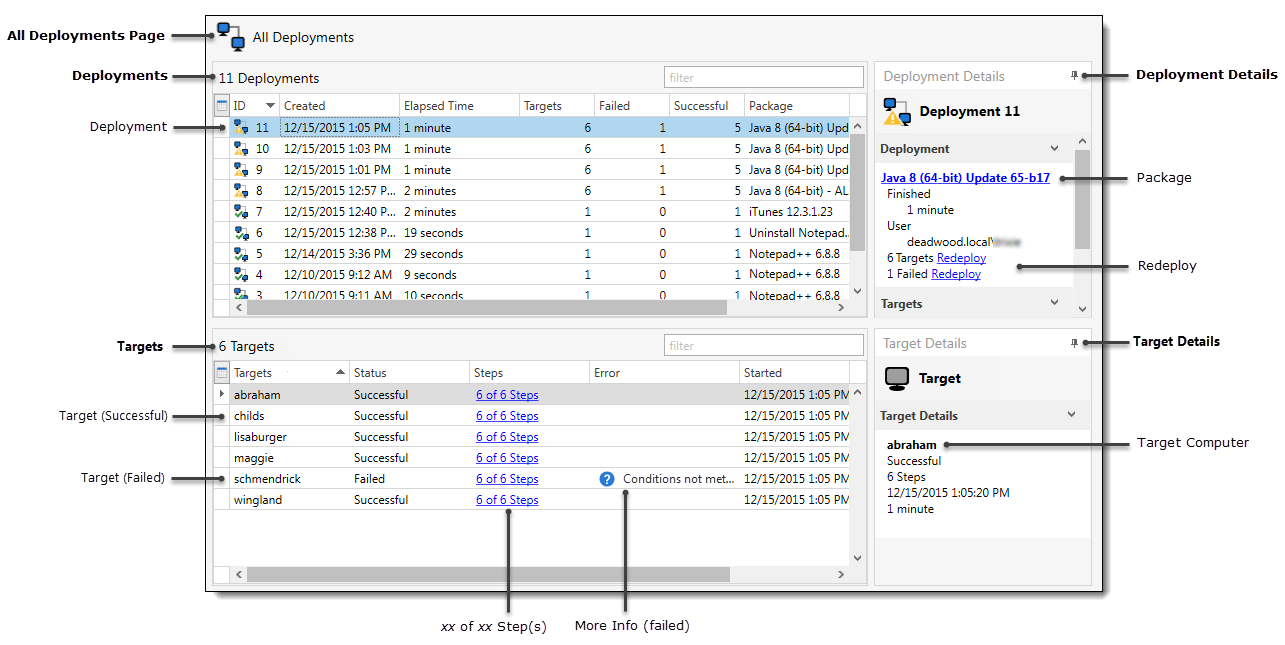
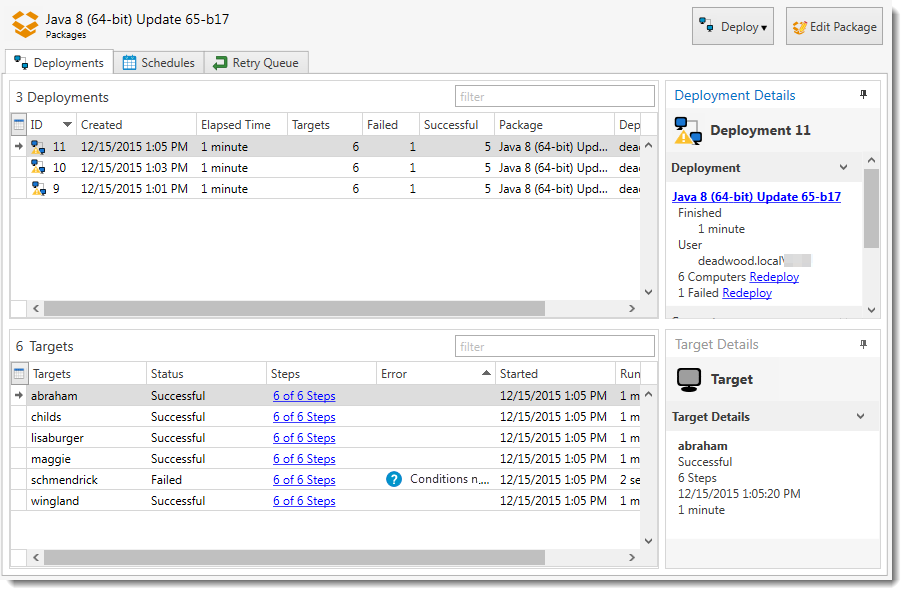
To view the All Deployments page, on the Main Console window, select All Deployments in the tree. The graphic below shows the All Deployments page with its components called out.
The panels can be resized by clicking ![]() between them and dragging. The sidebars can be pinned open
between them and dragging. The sidebars can be pinned open ![]() or collapsed
or collapsed ![]() . Click the sidebar to show or hide the details. For more information about sidebars, see Details Sidebars.
. Click the sidebar to show or hide the details. For more information about sidebars, see Details Sidebars.
Deployment Status Page Details
The following table describes the components of the status page (All Deployments and Package > Deployments tab) and the options available on each panel.
Panel/Sidebar |
Details |
|
Deployments |
Lists all deployments in the system (All Deployments page) or the deployments for the selected package (Package page > Deployments tab). By default, the list is sorted with the most recent deployment at the top (click the title of a column to change sort order). |
|
Redeploy |
Right-click a deployment and select Redeploy (or press Ctrl+R) or Redeploy to Failed Targets (or press Ctrl+Shift+R). Deployments can be redeployed to all targets, selected targets, or to all failed targets. This creates new deployments. If more than one deployment is selected to redeploy to all failed targets and those deployments are from different packages, then one new deployment is created for each package. |
|
Deployment Status |
To view the Deployment Status window for one deployment, select a deployment and double-click it or right-click and select Open Deployment Status (or press Ctrl+Shift+D). For additional information, see The Deployment Status Window below. |
|
Deployment Details |
Displays details about the deployment including deployment ID number, the name of the package, the schedule associated with the deployment (if applicable), the name of the Deployment Console, the Console User, and the number and names of computers. If multiple deployments are selected, this will only display the deployment ID number followed by the name of the package. |
|
Package |
Click the package name to view the package associated with the deployment. |
|
Schedule |
Click the schedule name to view the schedule associated with the deployment (if applicable). |
|
Redeploy |
Click Redeploy to redeploy to successful and failed target computers. |
|
Computers |
Lists target computers and their status information during and after deployment for the deployment(s) selected in the Deployments panel. |
|
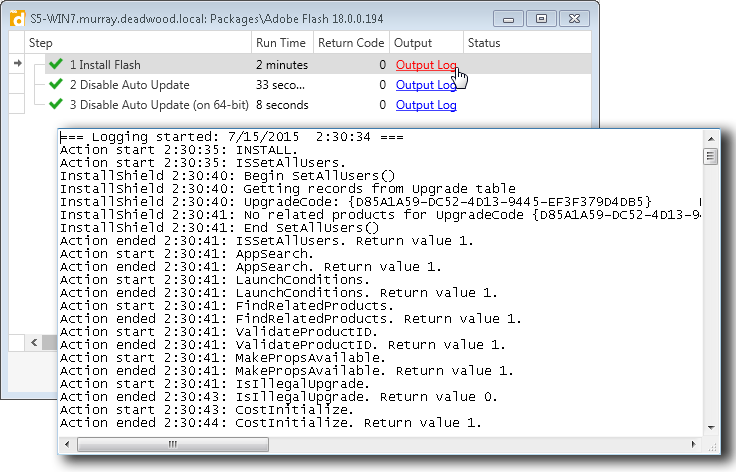
Click a Step link to view the status info for each step in the package. Click Output Log to view the details for a step.
NOTE: Output logs are created for .msi files or any install file or command that sends output to STDOUT. |
||
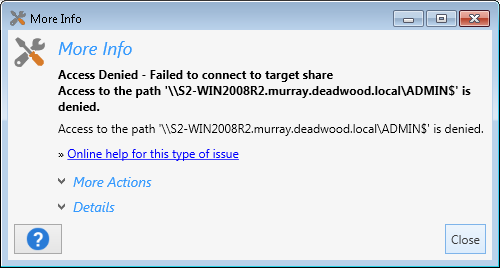
Click to open the More Info window, which shows the reason for the failed deployment and provides links to additional details and possible solutions.
|
||
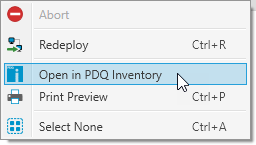
Abort |
You can stop an entire deployment or you can stop deployments to selected targets. Right-click a deployment (Deployment panel) or one or more selected targets (Targets panel), then select Abort. Aborted deployments may not stop immediately. The server may start the deployment before the interface is able to update and it may take some time to notify the computer to abort. In this time the deployment may finish. |
|
Redeploy |
Select one or more computers, then right-click and select Redeploy (or press Ctrl+R). |
|
Select one or more targets, then right-click and select Open in PDQ Inventory. The Applications page of the Computer window can be used to further verify a successful deployment. (Requires PDQ Deploy version 10 or later and PDQ Inventory 9 or later.)
|
||
Target Details |
Displays the status details for the selected target. |
|
Deployment Status Icons
When the status of a deployment changes, its icon changes. The table below explains the possible states of a deployment and the related icons.
State |
Icon |
Description |
Deployment Fail |
|
Deployment failed on all target computers. |
Deployment Start |
|
Deployment started and in progress. |
Deployment Success |
|
Deployment ran successfully on all target computers. |
Deployment Warning |
|
Multiple targets with a mixture of successful and failed deployments. |
Package Page—Deployments Tab
The graphic below shows the Package page > Deployments tab:
The Deployments tab on the Package page is essentially identical to the All Deployments page, except that it only shows the deployments for a single package. For details about its components, see the above tables Deployment Status Page Details and Deployment Status Icons.
NOTE: PDQ Inventory can be opened directly selecting one or more computer names, right-click and select Open in PDQ Inventory. The Applications page of the Computer window can be used to further verify a successful deployment. (Requires PDQ Deploy version 10 or later and PDQ Inventory 9 or later.)
The Deployment Status Window
To open the Deployment Status window, select a deployment and double-click it (or right-click and select Open Deployment Status, or press Ctrl+Shift+D). The graphic below shows the Deployment Status window for a single deployment.
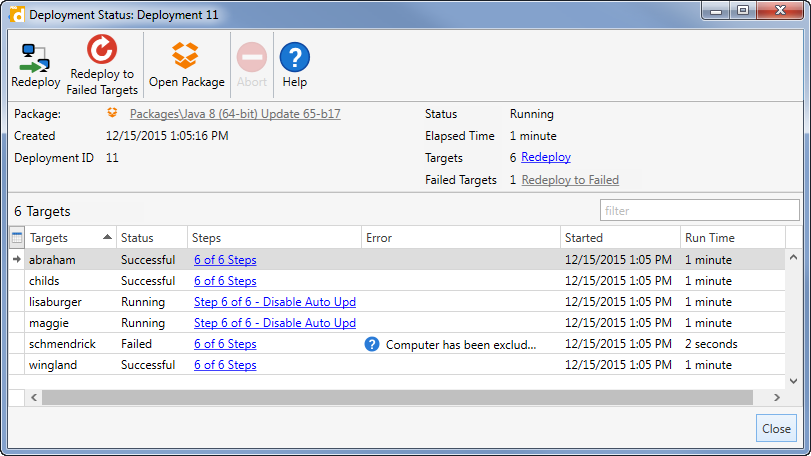
The Deployment Status window contains much of the same information and links for a single deployment as the Deployments tab or All Deployments page. For details about its components, see the above table Deployment Status Page Details.
NOTE: PDQ Inventory can be opened directly by selecting one or more computer names, right-click and select Open in PDQ Inventory. The Applications page of the Computer window can be used to further verify a successful deployment. (Requires PDQ Deploy version 10 or later and PDQ Inventory 9 or later.)
Schedule window - Target History tab
To open the Schedule Window, select the schedule and double-click it (or right-click and select Edit Schedule, or press Ctrl+O). The graphic below shows the Target History tab of the Schedule window for two deployments.
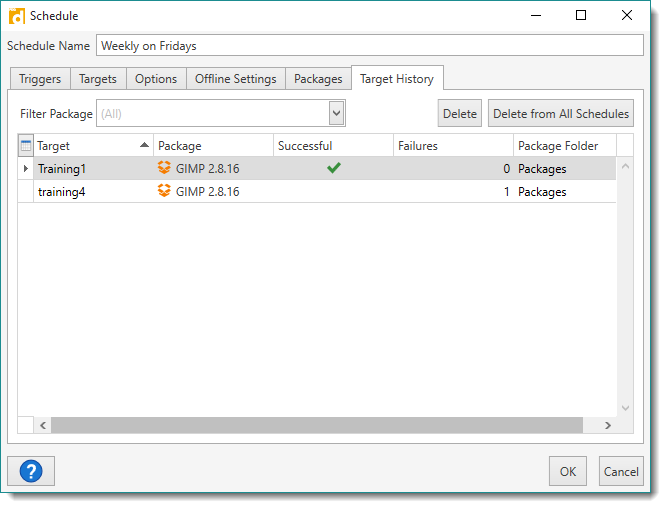
Although not as detailed as the other deployment windows, it does display successful deployment and the number of failures.
NOTE: PDQ Inventory can be opened directly by selecting one or more computer names, right-click and select Open in PDQ Inventory. The Applications page of the Computer window can be used to further verify a successful deployment. (Requires PDQ Deploy version 10 or later and PDQ Inventory 9 or later.)
© 2018 PDQ.com Corporation. All rights reserved.
PDQ.com is a trademark of PDQ.com Corporation. All other product and company names are the property of their respective owners.
Help Version: 16.1.0.0