In design mode you select the columns that will display in the chart and any filters that limit the data to be displayed.
Columns
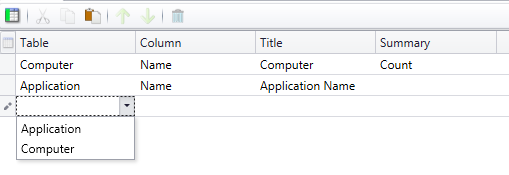
Table
When adding columns to a report only columns from applicable tables are allowed. For example, if the table includes a column from the Applications table then it cannot also include columns from Hot Fixes.
Summary
Each column can be displayed as a summary which results in a single value that summarizes the data relative to the other non-summary columns in the report. Not all summaries are available for all data types.
Summary |
Column type |
Description |
Count |
All |
A count of the unique values within the column. |
Sum |
Number |
|
First |
Text, Date/Time |
The first item alphabetically (for text) or chronologically (date/time). |
Last |
Test, Date/Time |
The last item alphabetically (for text) or chronologically (date/time). |
Average |
Number |
|
Minimum |
Number |
The smallest value. |
Maximum |
Number |
The largest value. |
Filters
A Filter Editor used to define the filters determining the data rows to be part of a report. The filters available for a report are the same as available for Collections.